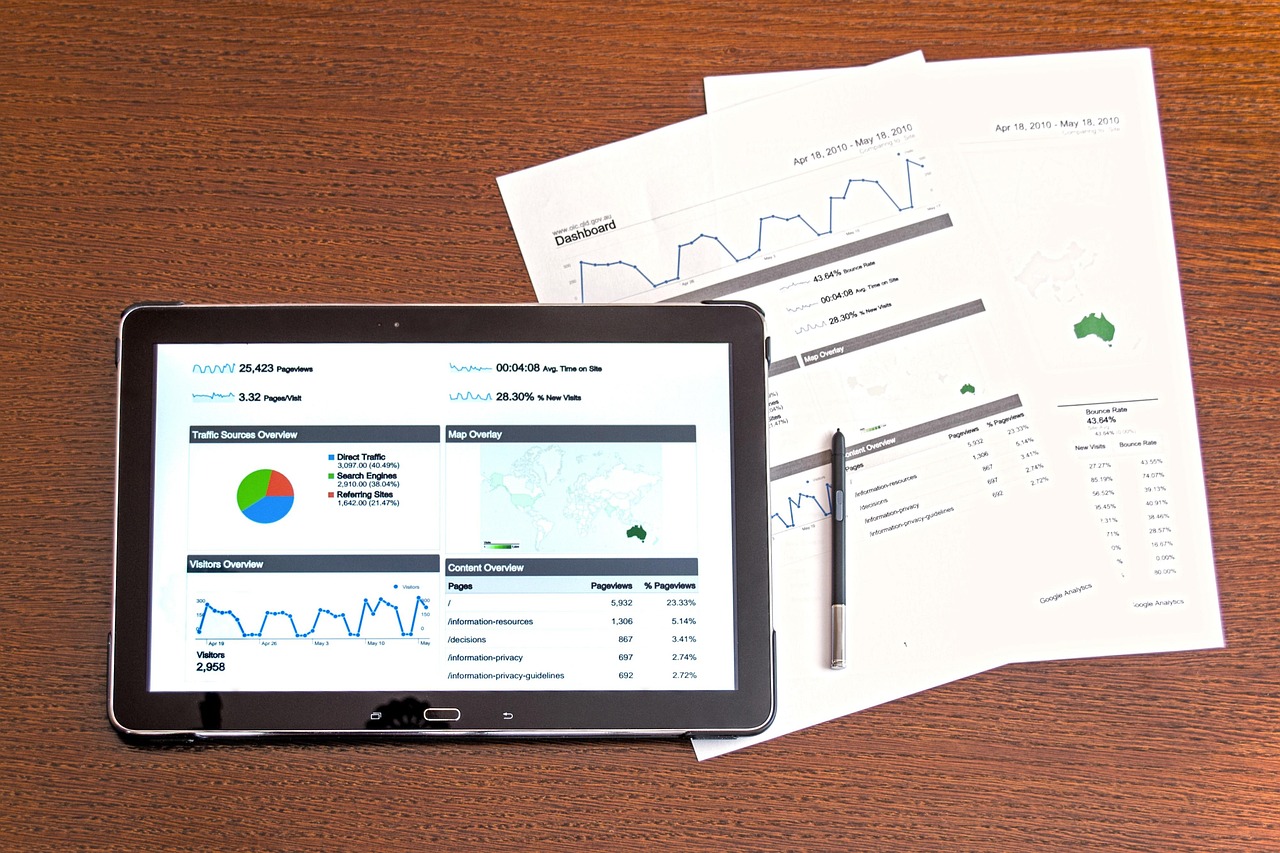
If you work in a marketing agency, you unfortunately know the feeling of a million tabs open, six different logins and a ‘quick’ report that takes up half your afternoon.
You’re likely wondering, ‘Why isn’t the data I need all in one place?’
That’s exactly what a data dashboard is for!
It brings every number into a single, live view that’s easily digestible, so your team can focus on insight, not admin.
At Lunar, we build white-label dashboards for marketing agencies, complete with insights that show what’s working, what’s not, and what to do next.
In this article, we’ll explore what data dashboards are and how agencies use them to blend data, design, and clarity into one straightforward view.
What Are Data Dashboards?
To put it simply, data dashboards are live, visual reports that presents your key marketing metrics in one place.
It combines data from Google Ads, Meta, LinkedIn, Google Analytics, Customer Relationship Management (CRM), and more into charts, graphs and visuals. These tools help agencies rapidly track, monitor and analyse key performance indicators (KPIs) to understand what’s really driving results.
Data dashboards are a live, visual, and digestible report of key marketing metrics that combine data from many channels into one place.
Instead of needing to use numerous platforms to piece together your report, you get a single screen showing you the successes and areas for improvement.
At Lunar, we call this your ‘Single Source of Truth’. It allows both you and your client to see the same story, backed by the same data.
What Goes Inside a Marketing Dashboard?
A useful dashboard gives you a breadth of information, not a simple summary.
Here’s what a data dashboard for agencies typically includes:
- KPIs: The performance metrics every client cares about, such as conversions, return on ad spend (ROAS), revenue and traffic quality.
- Channel Performance Breakdown: Performance on paid media, organic search, social media, email marketing and CRM.
- Attribution Modelling: View which channels actually drive conversions.
- Audience Insights: Demographics, acquisition sources and the on-site behaviour of your audience.
- Trend Analysis: See how your performance evolves over time, helping you visualise your long-term return on investment (ROI).
- Custom Recommendations: Tailored takeaways your account managers can apply straight away to improve performance.
How Do Agencies Use Dashboards?
The point of dashboards isn’t just to make reports look nice; the most successful agencies use dashboards to identify, understand, and act on opportunities faster.
Here are the 5 main ways agencies use dashboards:
1. To Streamline Client Reporting
Manual reporting is a task many agencies dread because it takes such a long time.
Data dashboards automate this process by combining real-time data from platforms like Google Ads, Meta, LinkedIn, GA4, and CRMs, all in one place.
Rather than your team spending hours sifting through spreadsheets and creating slides to update your clients on their performance, dashboards keep everything updated automatically.
This results in reports always being ready when a client asks and allows you to spend more time interpreting insights instead of collecting them.
2. To Prove ROI & Build Client Trust
Dashboards provide a transparent way to show clients what results their marketing spend is creating.
They allow clients to see results such as leads, revenue and ROAS, in a digestible way, which builds their trust in you as an agency.
Every client conversation becomes rooted in shared facts, not subjective opinions.
3. To Spot Issues Early
Noticing issues too late hinders progress and reduces client trust. Dashboards make any issues immediately visible.
You can spot problems like a dip in organic leads or a channel suddenly underperforming, instantly. This allows you to act before clients even realise there’s a problem, which turns you from a reactive into a proactive agency.
At Lunar, our dashboards include automated data validation and anomaly alerts, so you’re always one step ahead of your next client call. Request your free data report today to see your very own dashboard, or contact us if you’d like support.
4. To Align Teams & View the Full Funnel
Typically, agencies tend to split their focus by having dedicated PPC, SEO, social, and email teams working separately on each channel’s data.
Dashboards bring every piece of data together, displaying performance across all channels.

This means you can see the full picture of your client’s journey, such as which campaigns attract new leads and which channels actually close deals.
Your teams being aligned in this way ensures they collaborate better and prevents budget from being wasted on disconnected or duplicated efforts.
5. To Turn Data Into Strategy & Retain Clients
Simply looking at data isn’t valuable. Interpreting it is key as this leads to real improvements.
Dashboards provide the foundational information your team needs to understand what happened, and more importantly, why it happened.
Ultimately, dashboards highlight opportunity. They make it clear which channels are performing, which audiences are driving revenue, and which parts of the funnel need attention.
When you consistently deliver clarity, confidence, and actionable next steps, clients stick with you.
Ready to See Your Own Data Dashboard?
If you’re ready to make your data work for you, our team at Lunar would love to help you.
At Lunar, we build dashboards and reports that help agencies see clearly, move faster, and make smarter decisions every day.
Request your free data report today or learn more about our data services for agencies and start building your own single source of truth.
Got any questions? Contact us to speak to one of our experts.