At Lunar, we help marketing agencies cut through data mess and uncover the insights that matter. In 2026, data isn’t the problem, it’s interpretation. There are so many platforms that can give you the raw data, but how do you use that data to help inform decisions?
If you want to turn raw numbers into smart decisions, understanding how to analyse marketing data is the essential skill your team needs. This guide breaks down how to approach marketing data analysis like a pro, what metrics to track, and how our agency tools transform data into clear, confident action.
Why Analysing Marketing Data Matters
There’s more data available now than ever before. Between GA4, ad platforms, CRM tools, heatmaps, and sentiment tracking, marketers are buried in dashboards. But here’s the truth: having data isn’t the same as understanding it. Analysing marketing data properly gives you the power to:
- See what’s working (and what’s not)
- Make smarter budget decisions
- Prove ROI to clients and stakeholders
- Forecast future performance
- Identify growth and churn risks before they happen
Think of data analysis as the translator between effort and impact. It makes your work visible, and your recommendations undeniable.
5 Steps To Easily Analyse Marketing Data
Here are the 5 steps to analyse marketing data for your clients:
Step 1: Know What You’re Measuring. Start with the goal.
Are you looking to increase traffic, improve conversions, reduce cost per lead, or retain more customers? Once your goal is clear, you can match it with the right metrics.
Key Metrics to Track:
- Traffic & Source Quality: Are the right people coming to your site?
- Conversion Rate: How well does your site turn visitors into leads or sales?
- Cost Per Acquisition (CPA): Are you paying too much for each result?
- Return on Ad Spend (ROAS): Is your ad spend turning into revenue?
- Customer Lifetime Value (CLV/LTV): Are you keeping and growing customer value over time?
- Bonus: Always track engagement metrics like time on site, bounce rate, and scroll depth for additional context.
Step 2: Segment and Compare
Looking at top-level numbers is a start, but pro analysts dig deeper. Break down your data by:
- Channel (e.g. Google Ads, Meta, Email)
- Audience segment
- Device type
- Campaign and landing page
- New vs. returning visitors
By comparing performance across these segments, you can identify patterns, flag issues, and double down on what works.
Step 3: Use Visual Dashboards
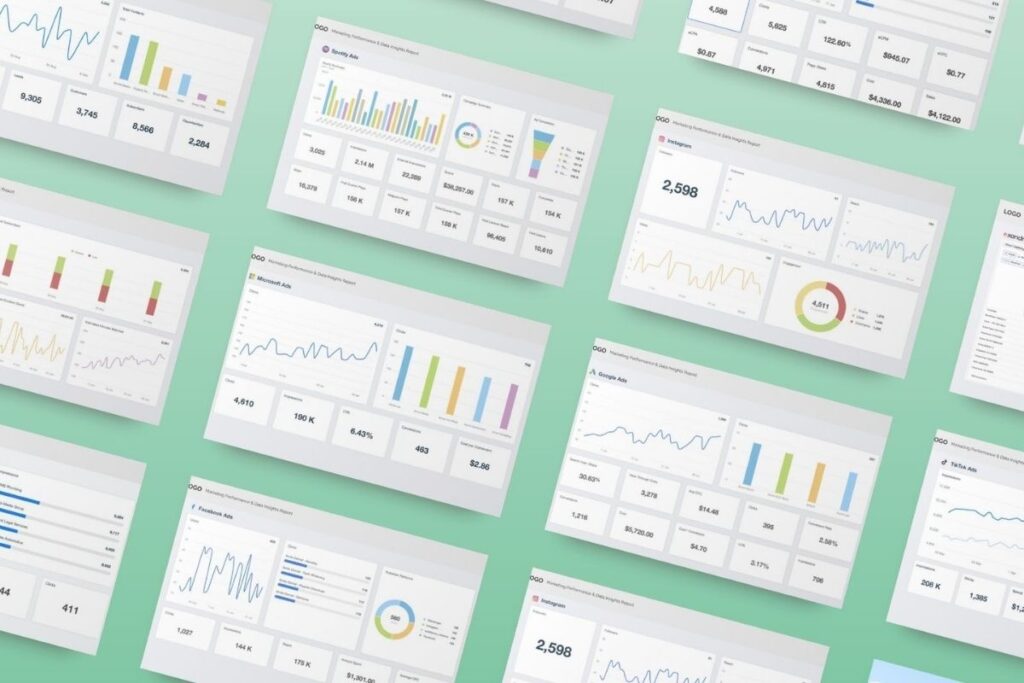
The best analysts don’t hoard data; they share it in a way clients can understand. At Lunar, we build custom dashboards that:
- Show key KPIs at a glance
- Track performance trends over time
- Benchmark results against targets
- Highlight wins and alert to risks
We use clean visuals, plain language, and clear calls to action. That’s what turns data into decisions.
Step 4: Extract Insights, Not Just Reports
A report isn’t useful unless it tells you what to do next. Professional analysis doesn’t just summarise the past – it informs the future. When analysing data, ask: what’s the story here? Spot anomalies, spikes, and dips, tie changes to campaigns, messaging, or budget shifts, and recommend next steps with supporting data.
Step 5: Automate the Process
You don’t need to start from zero every month. By automating data collection and templating reports across all your clients, you can refresh dashboards in real time, spot underperformance early, and deliver consistent insights without sinking hours into manual analysis. This lets your agency scale its impact without scaling the workload.
To take your analysis further, always tie insights back to business outcomes, not just marketing metrics. Use benchmarking to give numbers proper context, helping clients understand whether performance is good, average, or exceptional. And as client goals shift, make sure your KPIs evolve too.
Refining them regularly ensures your reporting stays relevant and actionable for all of your clients.
Q&A
Q: What’s the most important metric for analysing marketing performance?
A: It depends on your goal, but generally ROAS, conversion rate, and LTV are strong indicators of performance.
Q: How do I avoid being overwhelmed by too much data?
A: Focus on 3-5 core KPIs per goal. Build reports that show performance over time, not just static snapshots.
Q: What tools do pros use for data analysis?
A: It will depend on the situation, but the most common tools are: GA4, Looker Studio, CRM analytics (like HubSpot), attribution tools, and custom dashboards that combine multiple data sources.
Ready to analyse your clients’ data like a pro? Get your free client report from Lunar today and see how our agency-first insights help you prove your value and grow client accounts.